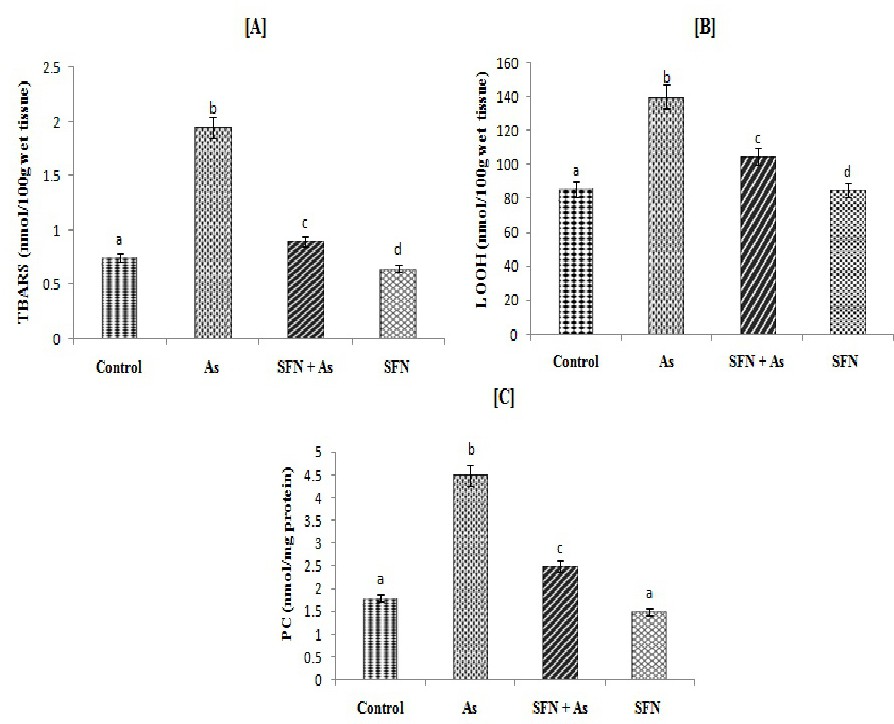
Fig. 2. Effect of SFN and As on TBARS, LOOH and PC in the liver of control and experimental rats. Values are expressed as mean ± SD for groups of eight rats in each. Statistical significance was determined by one way ANOVA (Duncan's Multiple Range Test). Values not sharing a common or same alphabet letter (a-f) and they differ significantly at P<0.05 (Duncan's multiple range test).